


Emini Futures | Emini Range Charts
(QQQ)(DIA)(SPY)(GLD)(SLV)

After a 90 point rally, the Dow Jones Industrial Average DJIA fell 33.45 points, or 0.3%, to 12,598.55, its lowest close since Jan. 18. The S&P 500 Index SPX dropped 5.86 points, or 0.4%, to 1,324.80. The Nasdaq Composite COMP declined 19.72 points, or 0.7%, to 2,874.04.
Emini Range Charts
We have discussed Time and Volume charts so far. Tonight we will address the Range Chart. With a Range Chart we still have Time on the horizontal axis and Price on the vertical axis but we manipulate the expression of price per candle based on our pre-defined risk parameters.
Range Bars are sometimes called Momentum bars. The candles look like a standard chart with an open, high, low, and close. The high-low range of each candle is constant based on the parameters you choose. A new candle does not start until a price tick or pip is received that would exceed the fixed range of the current candle.
Here are a few examples:
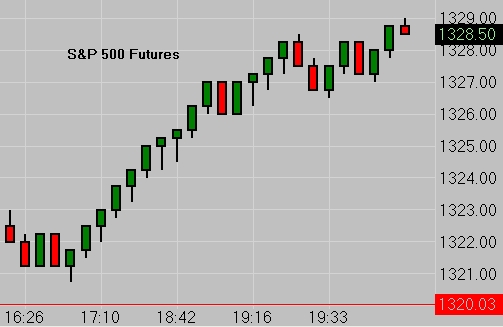
S&P 500 (ES) 4 Tick Range Chart
On the chart above each candle is exactly 4 ticks or 1 point. Each candle has a value of $50 per contract based on the parameters we have assigned it. Since each candle is 4 ticks, price must move 5 ticks to begin a new candle. If you are a trader with a daily goal of 2 points, 2 candles on this chart will do the trick. Based upon the market we are trading and our risk tolerance, we can adjust the parameters.
Before we look at another chart, here are 4 key facts about Range Charts -
- Each candle will always be the same height because of the pre-determined range.
- The close of a candle is always at the high or low.
- The open of a candle is always one tick below or above the close of the preceding candle.
- Time is irrelevant to range candles.
On the next chart we will look at the same time period in the S&P Emini but we will assign a range of 10 ticks per candle.
 S&P 500 10 Tick Range Chart
On the above chart we have changed the value per candle to 10 ticks instead of 4. Each candle now has a value of $125.00. The benefit of range charts for many traders is the reduction of signal to noise ratio. Also when daytrading or scalp trading, you can establish an order to buy or sell on a stop as you are able to determine at what price the next candle will open ahead of time.
We can just as easily create a range chart for Gold -
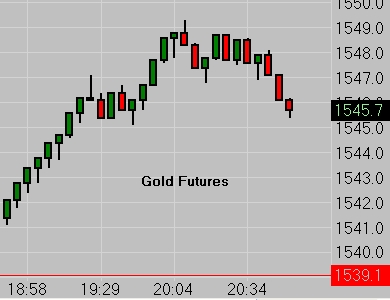 Gold Futures Range Chart
Using a 10 tick range each candle on the Gold Chart has a $100 value.
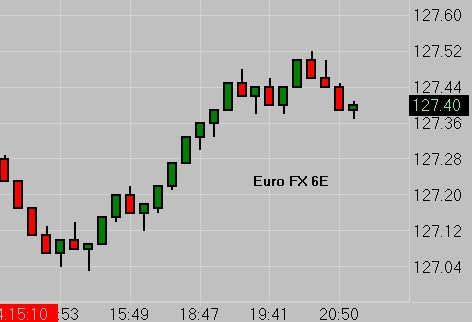 Euro FX 6E Range Chart
The Euro 6E above has a value of $12.50 per tick. We have set our range parameter at 6 ticks giving each candle a $75 value per contract. Range bar charts smooth out and eliminate noise in all markets because they are purely based on price action and not on time. One last benefit to consider with range charts is the ability to more easily spot clear areas of support and resistance.
Connect with us: ![]()
![]()
![]()
![]()
![]()
![]()
5 DAY FREE TRIAL
 emini charts
Reader Comments (2)
Emini futures has been taking a hit lately. In a technical sense, it has been trending downward. Hopefully, a rebound will happen and major support is found.
Thanks for sharing the charts. Being a math teacher the words don't mean near as much as the visual!