


Emini Futures | Emini Volume Charts
(QQQ)(DIA)(SPY)(GLD)(SLV)

The S&P 500 Index SPX fell 7.69 points, or 0.6%, to 1,330.66, ending below a key technical support, at 1335. Down 9 of the last 10 sessions, the Dow Jones Industrial Average DJIA dropped 63.35 points, or 0.5%, to 12,632.
CFRN Partners spent the day trading inside of a range defined by our Weekly Trading Zones. Is it possible to wring 35 points out of a 7 point range? Probably not, but it can be fun trying...
S&P 500 Emini Futures
;) click to enlarge
click to enlarge
Emini Volume Charts
Here are 2 examples of Volume Charts. The first chart is the S&P 500 Emini Futures.
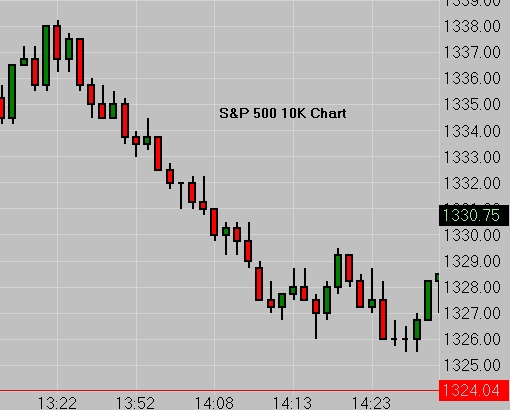 S&P 500 Emini Volume Chart
Just like last night we can still see both Price and Time on our chart but we now have the benefit of a 3rd important piece of information known as Volume. What is Volume?
Volume - In the equity markets, fractional ownership of a company is traded in what are known as shares. In the futures market we trade what are referred to as Contracts. Many traders stand firm on the belief that the more Volume a market possesses, the better the market. While more volume or liquidity as it is often referred to does reduce the spread between the bid and ask price, it also keeps some of the smaller volume markets out of the limelight and in doing so can present you the retail trader with exceptional opportunities.
On the Volume Chart above each candle represents 10,000 contracts. Each time 10,000 contracts exchange hands, a new candle is created. Keep in mind that even though we have the benefit of time on the horizontal axis and price on the vertical axis, it is Volume that creates this chart. Depending on market conditions you could see 1 candle painted in a minute or it could take an entire day. For it to take an entire day is an extreme example but I want to make sure you undestand that volume is the creative force when working with Volume Charts. Both Price and Time are simply signposts on the road up ahead...
Over time you will learn to spot when the market is "slow" as compared to when it is "fast". You will also learn to spot when a significantly large amount of volume is unable to move price, and the opposite, when very little volume is able to move price a great distance. Understanding thedynamics at work behind these observations are critical in your journey to become an Emini Trader.
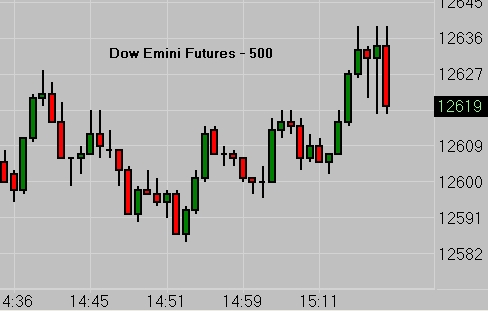 Dow Emini Volume Chart
The above chart is the Dow Emini Futures (YM). On average you will see 100,000 contracts traded in a day. For most retail traders this is still quite sufficient in regards to volume. Each candle on the chart above represents 500 contracts. These charts should not be confused with Volume Analysis, Delta, or Market Profile. Those are different concepts entirely and will be covered in the future.
Our co-host David often speaks of the market as being 3 dimensional in that it is comprised of Price, Time and Participation (volume). The following link may provide you with an "awakening" to this concept or it may simply give you a "hearty chuckle".
Either way, I am pleased.
Connect with us: ![]()
![]()
![]()
![]()
![]()
![]()
 Editor
Reader Comments (1)
Hello, I fully appreciate the value of volume charts, can you please provide some information on what charting packages provide volume charting. thanks