


S&P 500 Technical And Fundamental Analysis

S&P 500 Technical Analysis
Daily Chart
- Price is above the 50 Period SMA
- Price is above the 200 Period SMA
- The 50 Period SMA is above the 200 Period SMA
- The last Golden Cross was on January 31, 2012
- Price is currently testing the top of its Channel
This is the 3rd test of the top since the Channel began April 2, 2012
;) S&P 500 Daily Chart
S&P 500 Daily Chart
(click to view)
Analysis - This chart is dynamically bullish. However the top of the channel is the key. If we break out and hold the top of the channel on a pull-back, we can anticipate much higher prices. On a strong break we would expect to see 1406/1407 followed by possibly1439/1440. However, if price fails to break out of this channel we should anticipate a significant drop back to the 1340/1341 area. We expect this situation to resolve itself within 3 trading days or less.
S&P 500 Fundamental Analysis
Analysis - Congress goes on vacation this Friday. There are rumors afoot that suggest the Obama Administration and House Republicans could emerge this week with a surprise compromise in which the Bush tax cuts would be extended for all but the wealthiest Americans, with the bar being as high as $1 million to $5 million per year in household income.
If this happens, the market would likely respond quite favorably. The uncertainty of the fiscal cliff would be overcome. Europe would move higher as well. European leaders have said the fiscal cliff is having a depressing effect on share prices there until more more is known about next year's U.S. tax regime.
Last Wednesday a Wall Street Journal article suggested the Federal Reserve was ready to mount a third round of quantitative easing in a renewed attempt to stimulate and stabilize the U.S. economy. This story sparked the late-week rally which continued today. Last Thursday European Central Bank chief Mario Draghi (Super Mario) said he would do whatever it took to save the euro. Friday, German Chancellor Angela Merkel and French President Francois Hollande formally agreed with Draghi. Saturday Treasury Secretary Geithner left for Germany to talk with his comrades.
Fundamentally we have a lot cooking. However, we have to get through the next 2 days as the FOMC meets, followed by an ECB press conference on Thursday. If the markets get what they want (more stimuli) pop goes the weasel. If there is the slightest hint that we won't, pop becomes flop.
How To Trade It - Once again the key is the test of the top of the channel on the S&P Cash Daily Chart which is currently underway. From an Emini Futures point of view -
Consider buying ESU2 1397 Stop or selling 1371 Stop. Charts are bullish but we have FOMC, ECB, and Employment data coming. #SP500 $ES_F #ES
— DeWayne Reeves (@CFRN) July 31, 2012
Since we anticipate volatility, the setup provides an opportunity to take advantge of the move no matter how the wind breaks. As always - Use A Hard Stop!
S&P 500 Emini Futures Twitter Feed
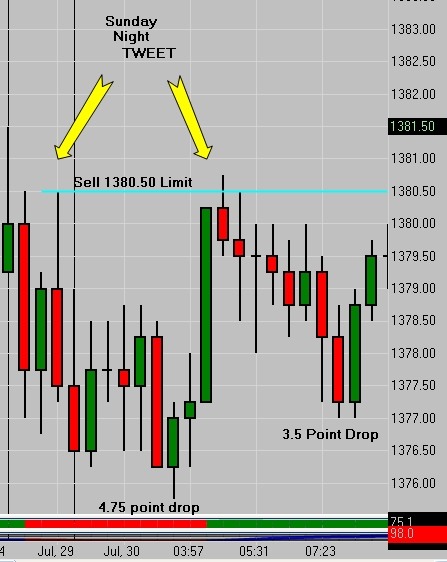 S&P 500 Emini Futures Globex Tweet
Last week we published a post - Why Important Prices Are Almost Always Tested
I encourage you to read it and then look at the entire day today and see if you also think 1380.50 was an important price. Not only will you see the resistance in the chart above, but you should also see where it became good support. If you have any trouble spotting it, pop in to the Live Emini Trading Room tomorrow or give us a call.
November Soybeans
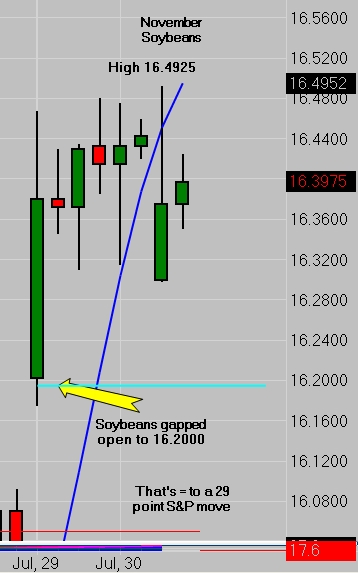 November Soybeans
Over the weekend, those who were watching the feed closely saw a suggestion to consider buying November Soybeans @ 16.1500 Stop with a consideration to add more @ 16.3600 Stop. If you saw it and caught it... Cheers!
Questions?
Call us toll free @ 866-928-3310 during normal business hours.
After Dark - email support@cfrn.net or call 415-857-5654
Discussed on today's broadcast: (SPY)(DIA)(GLD)(FB)(TSLA)
Connect with us: ![]()
![]()
![]()
![]()
![]()
![]()
Please leave a review on iTunes
 Editor
Reader Comments