


How To Spot Market Tops
(QQQ)(DIA)(SPY)(GLD)(FB)

In the world of trading there are few absolutes. Here are a few simple tips to help spot major market tops.
How To Spot Market Tops - 3 Tips
Tip #1) Don't go looking for it. If you spend your days looking for the next major market top you will not only miss a lot of opportunities, you will also get it dead wrong more often than not. Spend your time learning to trade whatever the market presents. Each day it will bring you something new and different, something to challenge you, something to change you. Look back over the history of whatever market you are interested in and get a perspective of how many major market tops there have been and then consider the odds of when the next one could happen along and ask yourself what skills you will need to not only know that it is transpiring, but to execute and manage it successfully.
Tip #2) All time frames are suitable for trading. What is important to understand is that the information relayed by a 1 minute chart is relative to a 1 minute chart. Yes the markets are fractal in nature, and that is why you will want to observe larger time frame charts at least once a week to stay in touch with what is shaping up from a larger perspective. You can use the same techniques to trade a 1 minute chart as you would a monthly chart. The difference is in the risk required, the potential for gain and the frequency of opportunity. On a 1 minute chart you'll see 60 candles in an hour vs. the 20 candles you see on a monthly chart. If you remain a trader long enough, these trades will come to you in time. Be careful that your career is not built solely on seeking opportunities that may only present themselves 2 or 3 times in a decade.
Tip #3) While there are many sophisticated tools and indicators available for predicting markets tops, may I suggest you go to your trading library, find the oldest and dustiest book of on the shelf, blow off the dust, open it wide and absorb some of the most basic chart patterns that have been around since the advent of technical analysis. Keep in mind you are not searhcing for these, you are waiting for them to appear and YES, there is a world of difference. In future posts I will expand the charts to include monthly and possibly quarterly. In this example we will look at a simple Weekly Chart.
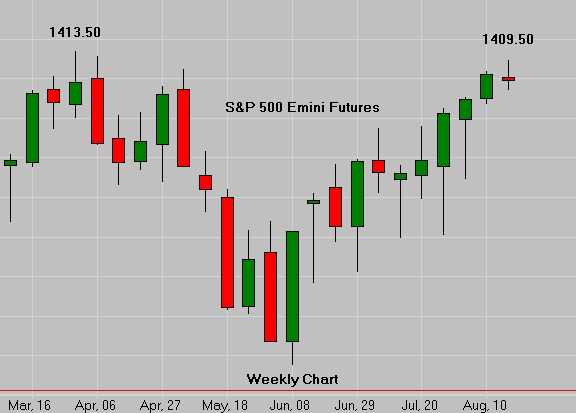 S&P 500 Emini Futures Weekly Chart
This chart clearly shows us the most recent market high was on March 30, 2012. This is a Globex chart of the Emini Futures. Many traders would prefer to use the S&P 500 Cash Chart which would only reflect pit traded prices. For our purpose here, which is to keep this entire process quite simple, either chart will serve you well as our goal is simply to "notice" a move that if it follows through, could potentially last for many months or at extremes, possibly even years.
This chart shows what could become a Double Top on a weekly chart. You could see this just as easily on a monthly chart. Now that we are aware of the possibility of potential resistance overhead, we will drop down to a daily chart.
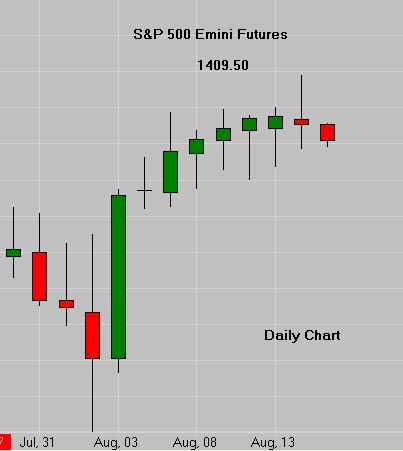 S&P 500 Emini Futures Daily Chart
We can see on the daily chart that we have some very small body candles over the past 8 trading sessions including the current one. If you study the chart a bit you will notice a shape somewhat akin to an upside down saucer. In your old dusty chart book it may very well be referred to as a "Rounding Top".
Notice also the extended upside wick and extremely small body of the previous day's session. It is also the first red or "bearish" colored candle we see in the progression of this pattern. Although the previous 6 sessions showed slowing upward momentum with their narrow bodies, the closing price was still higher than the opening price. On candle six the close is lower than the open, hence the change in color from green to red.. That change in the weather along with the Hanging Man we saw on day 5 has now caused us to "notice" that something might actually be taking place here worth taking notice of.
If in fact it turns out that this is a major market top, this trade will be in play for quite some time as noted above. Patience is required to simply observe and see what develops. Aggressive traders will perhaps be ready to enter or already in this trade. If so, stops have to be just above the high of March 30th. Waiting for additional confirmation is suggested at this point.
In closing let's see what we find on the hourly chart.
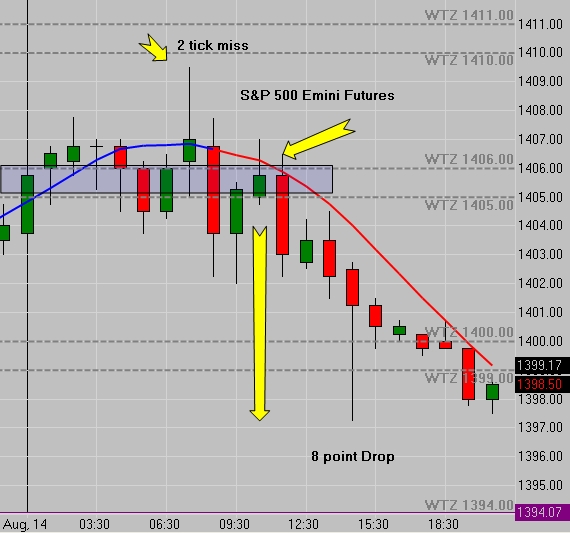 S&P 500 Emini Futures Hourly Chart
In today's Live Trading Room and at the end of our Daily Live Broadcast, we pointed out that if 1406 held as resistance we would anticipate lower prices. Price was addressing both the Weekly Trading Zone and the CF_MA1 was overhead and falling. Together these two factors have now added to what we saw above on the daily chart and also on the weekly chart.
Does this mean a Major Market Top is imminent? No. The table is set, the windows are dressed and the conditions are favorable. Only time and the market itself will reveal the outcome.
In upcoming posts we will continue to track the bigger picture and identify important indications as they appear. Be sure to follow us on Twitter to make sure you stay up to date on our latest ideas and entries. Even better, install our 100% Safe Certified Emini Futures Toolbar.
Connect with us: ![]()
![]()
![]()
![]()
![]()
![]()
Please leave a review on iTunes
 Editor
Reader Comments