


Emini Futures | Top 3 Bullish Candlestick Patterns
(QQQ)(DIA)(SPY)(GLD)(FB)

Japanese Candlestick Patterns date back 300 plus years to rice traders in Japan. It is not mystical, magical, or madness. It's not even science. It is purely and simply a graphical representation of investor sentiment. The larger the time frame, the more important the signal becomes. It is only in the past 25 years that this type of trading found its way to the West.
Because of the "odd sounding" names, candlestick patterns are often dismissed as new-age, esoteric, or even a black art. Nothing could be farther from the truth. Candlesticks are a "no-spin" zone. You are not looking at someone's idea of what might happen or even someone's interpretation of what did happen. You are looking at exactly what really happened. No fluff, no filler, and no filters. Watch it unfold in real time and you not only see where the candle opens, where it closes, its high and its low, you also see who the dominant force was (buyers or sellers) as the candle was being built.
Top 3 Bullish Candlestick Patterns
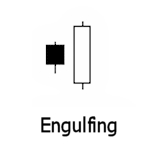
Bullish Engulfing Pattern: This is a powerful 2 candle pattern. The first candle is a narrow range candle that closes down for whatever time period is being observed from a 1 minute chart to a weekly, monthly, or even quarterly time frame. The sellers are in control based on the context of the downtrend. We have a narrow range bearish candle and volatility is low. The sellers appear to have lost their momentum. The second candle is a wide range bullish candle that "engulfs" the body of the first candle and closes near the top of the range. The buyers have overwhelmed the sellers as demand is now greater than supply. Buyers are now in control!
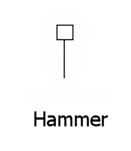
Bullish Hammer Pattern: The Hammer pattern is a single candle pattern which appears in the context of a downtrend based on the time frame you are trading. It signifies a weakening bearish momentum. The long lower wick signifies an initial continuation of the downtrend. However, buyers step in and drive the price higher to close near its opening price. Look for a small body and a long wick.
If a hammer forms near a known support level or Weekly Trading Zone, then the likelihood of a bullish reversal is quite good. However, when a hammer forms in the middle of a trading range it is nothing more than a continuation signal. Context is always critical with candlestick patterns. The ideal condition for this signal is for the wick length to be several times longer than the body of the candle. The longer the wick and the smaller the body, the more powerful the signal. This shows that buyers have stepped in with confidence and are at least willing to attempt to drive price back up. Even if they fail in their attempt, you can quite often scoop your 2 points of opportunity out of their attempt, successful or not.
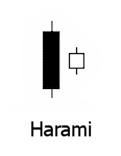
Bullish Harami Pattern: The Bullish Harami is a two candle formation pattern. The first candle is a large bearish candle appearing in the context of a downtrend. The end of a downtrend is represented by a known support area or Weekly Trading Zones. The pattern is formed by the second candle opening above the previous candle's close and closing below the previous candle's open. In Japanese, Harami means pregnant woman. As you see can clearly see, the black candle is the woman's body, the white candle is her baby and your trigger.
Do not confuse this with the engulfing pattern. The candles are opposite! The longer the bearish candle and the bullish candle, the more forceful the potential reversal. The higher the bullish candle closes up on the bear candle, the more convincing that a reversal has occurred despite the size of the bullish candle. Not only does this candle alert you to a potential reversal, it also serves as a gauge as to how powerful it may be.
Bonus Bullish Pattern
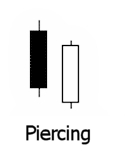
Bullish Piercing Pattern: This is also a two-candle reversal pattern. The first candle is a bearish wide range candle that closes near the bottom of the range in the context of a downtrend. The sellers are obviously in control at this point. On the second candle you see a wide range bullish candle that close at least halfway into the prior candle. The second candle opening lower than the close of the prior candle adds great potential to this pattern. The longer the candles, the more forceful the potential reversal.
When this signal is accompanied by high volume or if you are using a Volume Chart as taught in our Live Training, this confirms the strength of the signal. On the Volume Chart you want to be observant as to how quickly this pattern prints.Based on the volume chart you are using you already know exactly what the volume will be in this pattern. For you the speed of the print become important.
Tomorrow night > Top 3 Bearish Candlestick Patterns
Connect with us: ![]()
![]()
![]()
![]()
![]()
![]()
Please leave a review on iTunes
5 DAY FREE TRIAL
 emini charts
Reader Comments