


Emini Futures | Understanding Emini Price Action
(QQQ)(DIA)(SPY)(GLD)(SLV)

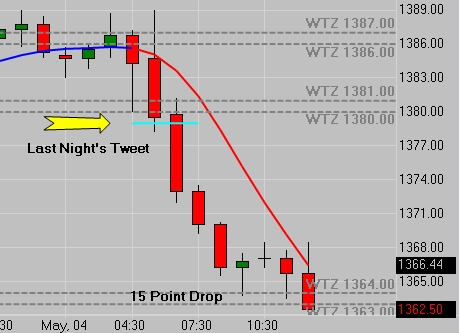
The S&P 500 Emini Futures finished the week on a downbeat note @ 1362.50 as a result of a weakening jobs report and continued uncertainty in Europe. The biggest news of the day was Crude trading back below $100 a barrel. Down almost $5 at one point during the session Crude closed @ $98.59 off $3.59 from Thursday's close. The move in Crude came as no surprise to listeners of our Daily Live Broadcast.
As you recall last week, the S&P Emini closed 1 point below our highest Weekly Trading Zone and this week we closed 2 ticks below our lowest Weekly Trading Zone. Here is a chart of the weekly close -
 S&P 500 Emini Futures Weekly Close 05/04/12
Understanding Emini Price Action
The fundamental issue that confronts a trader every time he sits down to trade is whether the market is trending or not trending. If we determine it is trending, we will look to enter in the direction of the trend. If we determine it is not trending, we look to enter in the opposite direction of the most recent move. Unless of course we have pigeonholed ourselves as counter trend traders then the opposite of everything I just explained is what applies to you.
The true definition of a trend is much like the definition of beauty - it lies in the eyes of of the beholder. One man's trend can easily be another man's chop. When it comes to beauty it can be as simple as strolling through the mall aimlessly. When we spot beauty it will stop us dead in our tracks. No one needs to lean over and whisper in our ear "She's cute". Our brains are hard wired to know it, spot it, track it, snag it, bag it and tag it.
Emini trends while still defined by the eye of the beholder, require a little more study. When it comes to physical beauty you are once again "hard-wired" with whatever makes your heart go thumpity-thump. Trust me, (he says slightly embarrassed) an S&P 500 Emini Chart can literally have the same effect but it is learned behavior, an acquired taste that comes from many hours of studying many charts and multiple time frames. While you may never "understand" your object of beauty in the physical world, it is your "required understanding" of what a stock or emini chart is telling you that steals your heart and to often... your wallet.
You naturally know that you like tall or short, slender or buff, blond or brunette, but as you enter the world of trading you have no clue what you like. You're just here to make the big bucks so you can go pursue your passions. In order for that to happen you have to first figure out what type of trader you are. Are you a position trader, swing trader, day trader, or scalper? Can you be more than one? Yes.
The first time you look at a price chart the only emotion you experience is confusion. (like a cast member on Glee) Whether you're looking at a 1 minute chart, a 10k contract chart, or a quarterly chart, what you have to embrace is that each candle or bar is relaying important information relative to the time frame of the chart you are observing. People who are hooked on extremely short time frames will say that the other guy is risking too much. The trader who never looks at anything smaller than a daily chart will profess that intra-day traders are caught up in the noise. The latter swears he is listening to Yo-Yo Ma on his hi-fidelity Bang Olufsen while the other has nothing but static on his AM transistor radio
Both are as right as rain and both as confused as frogs in a hailstorm.
The good news is, I'm here to help you sort it all out.
If you spend enough time looking at charts, once you understand what information they are conveying, you can then begin the process of discovery which ultimately leads you to your chart preference. (see Glee reference)
Once you know who you are, where you stand, (or sit), then we can begin to understand emini price action. This will be an ongoing series so let's cover some basics that will help you understand who you are and what makes you tick.
On an intra-day basis the average Emini Swing is 3-5 points. What's the average on a Daily, Weekly, Monthly, Quarterly? We will cover these over the next few days. Once we've identified the "average swing" in a particular time frame, we will show you that the exact same understanding of emini price action will serve you no matter what time frame excites you. In other words - True Love Is Blind.
Pick a time frame and you can learn how to read it. If you can read it you can understand it. If you can understand it, you can profit from it. Are you ready? Stay tuned for the next installment.
S&P 500 Emini Futures Recap
Here's where the rubber meets the road. This is where conjecture ends and reality slaps you in the face like a cold fish. This video is an expression of pure price action. Do we have indicators the allow you to see what price is expressing? Yes. Have I removed them from the chart in hopes that you'll actually SEE what's happening? I have and I hope so. Mazol Tov!
ES Emini Futures Recap 05/04/12
WANT TO LEARN EMINI FUTURES TRADING?
Connect with us: ![]()
![]()
![]()
![]()
![]()
![]()
Please leave a review on iTunes
 Editor
Reader Comments