


Fib Tips For Emini Traders - Part 2
(QQQ)(GOOG)(UA)(AAPL)(SPY)

Luke's Nephew: [on visiting day] Uncle Luke? Why can't you have chains?
Luke: John-boy, lemme tell you something. You know, them chains ain't medals. You get 'em for making mistakes. And you make a bad enough mistake, and then you gotta deal with the Man. And he is one rough old boy. (Cool Hand Luke 1967)
Fib Tips And Other Head Trips Part 2
As traders we are quick to put on mental shackles. Bind ourselves to a way of thinking that lives somewhere between no-sense and nonsense. We paid our dues ($99.95) to the indicator man, had a free lunch and spent 3 hours earning a degree from the traveling seminar man ($299.00) and now we're ready. Bring on those champagne wishes and caviar dreams. How did I live so long without hearing about this trading stuff? Oh well, no time for remorse but I do feel sorry for those poor fellows who haven't heard the good word and still have to earn a living by the sweat of their brow. Perhaps I can help a few out in the future in my spare time, but for now I gotta' get clicking and start making those ticks cause "Come on baby, daddy's about to get rich".
Luke may have made a few mistakes in his day, more than a few, but one thing he fully understood was that the Man (in our case - the Market) can be a rough old boy. No trader makes it through unscathed. We all get a little taste of the snake oil in one form or another. For some, one taste is enough. Unfortunately for others, the never ending search for a quick fix of easy money, it just... never ends.
Those who do come to their senses early on figure out just like Luke did, there are no shortcuts. If you are going to succeed in building your trading business you must Learn How to Trade. Interestingly enough, the most powerful tools available in today's hi tech trading arena are in my opinion, not the new ones, they are the ones steeped in a rich history, the ancient of days.
- Candlestick Signals - 400 years old
- Fibonacci Sequence - Created "In the beginning" discovered by man recently in 1202
In our previous article Fibonacci Tips For Emini Futures Trading we covered the basics of Fibonacci Retracements in the context of an uptrend. In this article we will use the same concept and approach, we will simply apply them in the context of a down trend. This is a large part of why Daytrading Emini Futures is so attractive. Unlike investing in a company where you often wait weeks, months, even years for the stock to appreciate, with Emini Futures, profit opportunities are as readily available in a downtrend as they are in an uptrend.
Sidebar:
Pattern daytrading rules do not apply to Emini Futures. You are not required to maintain a minimum $25k account balance as you are when trading Stocks and ETF's. Check with a licensed broker to make sure you understand the margin requirements for trades held beyond 3:15PM Central. (866-928-3310)
Fibonacci Retracements In A Down Trend
In a down trend, the basic idea is to be a seller in the market as price pulls back to a Fib Resistance level. In the examples below we will use both volume and time based charts. However, just as when we applied Fibonacci Retracements to an uptrend, any of the following chart types are acceptable.
- Volume
- Price
- Time
- Range
- Tick
As long as you are using the same swing low and swing high price when calculating and/or drawing your levels, the style of chart is not relevant. Different charts serve different purposes, but that is a broad subject unto itself and well beyond the scope of this article. Suffice it to say, whatever style of charting you are most comfortable with is the one you should use as we lay your foundational understanding of Fibonacci and its application in trading.
In the down trending examples you will use your built in fib tool and simply click the swing high and drag your cursor to the swing low and release your mouse button. You are simply reversing the steps covered in Part 1. Let's get Fibbing!
The first chart we will use is a Volume Chart -
 (ES) SP500 Fib Levels
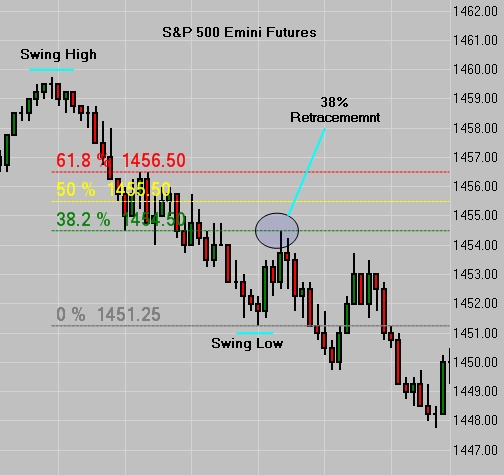
We drew from the swing high at 1459.75 down to the then current swing low at 1451.25. There was no way to know for sure that 1451.25 would be the swing low, but with each candle that closes lower you simply continue to measure until you reach a level where you get a minimum 38% retracement. In this example price pulled back to 1454.50 which was a perfect 38% retracement to the tick. In this example the difference between the 38% and the 61.8% retracement was 2 points as opposed to our previous example which was 2 ticks. The entire area from the 38% to the 62%, or 1454.50 to 1456.50 is an "area" and quite suitable for this example.
We of course have the benefit of using a historical chart to present the perfect "textbook" example. In real time when trading live you must be able to think on your seat. (unless you trade standing) From the 38% pull back @ 1454.50 we had an initial drop to 1449.75 or 4.75 points. If we measure the entire move after the secondary pull back we drop to 1447.75 and have a potential maximum profit of 6.75 points.
Keep in mind, we had the luxury of locating a perfect "textbook" example after the fact. If we had sold the 38% retracement on "blind faith" what was our risk? A draw down to the 50% level would have been 1 point. A draw down to the 62% level would have been 2 points. A draw down to just above the swing high would have been 5.75 points if we want to maintain the integrity of being at least 2 ticks above the swing high which is what we recommend. The question you have to ask yourself is "Does my account size and risk profile allow me to risk 5.75 points on one trade?
Although this trade ultimately made a very nice move down to 1447.75, the initial target in real time would have been the previous swing low at 1451.25. This reality check changes the dynamics. From the 38% retracement entry at 1454.50 to the previous swing low is 3.25 points. Please understand, 3.25 points profit is a very nice trade indeed, in fact it's what we call "A Day's Work". If you are trading 1 contract, as you should be if you are new to trading, the potential income from this trade would be $162.50 before commissions.
Sidebar:
If you are a self directed trader who executes your own trades via an electronic platform, your transaction cost per trade should not exceed $7. That figure includes the cost to enter and exit the market per contract. This figure must be factored in as you write your Business Plan. This is a fixed cost of doing business and will also affect your written Trading Plan. In the absence of both a written Business Plan as well as a Trading Plan, you do not yet have a business, you have a hobby.
The difference between trading 1 contract and 10 has nothing to do with money by the way, it has everything to do with your maturity as a trader. Just as earning $1,625.00 on 10 contracts might seem easy on the surface, losing $1,625.00 is the alternate reality and potentially far more devastating psychologically than financially. If you are willing to risk 5.75 points for a potential profit of 3.25 points I suggest you rethink your business plan as well as your trading plan. A risk to reward ratio negatively skewed will make it very difficult to keep the doors open on your Emini Trading business. Sometimes we simply have to pass on the most picturesque opportunity because the numbers don't line up. As I mentioned in Part 1 of this discussion, moving from Retail Trader to Professional Trader will require you to recognize that no position is a valid position.
I have now wandered far outside the scope of this article so let me reign it in and get back to helping you master Fibonacci as an Emini Trading Tool. Let's look at another perfect textbook example on a time based chart.
 (ES) SP500 Fibs - Hourly Chart
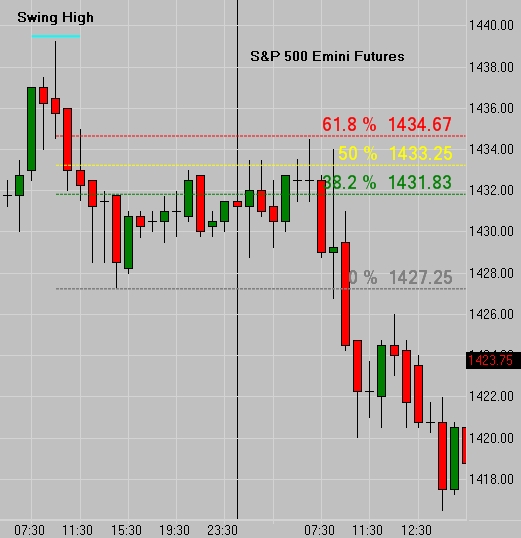
Using an hourly chart we are able to readily identify a significant swing high at 1439.25 and a swing low at 1427.25. The initial pull back was to the 38% level. The 38% level failed to hold and price pulled up to the 50% retracement. The 50% level held briefly but ultimately the market rallied to the 61.8% level before reversing. Since we are on an hourly chart it is not surprising, but expected that the price range between levels will be significantly larger.
If you sold the 38% level on "blind faith" your draw down in this example would be from 1431.75 (rounding down as the market only trades in 1/4 point increments) up to 1434.50 or a total of 2.75 points. Courtesy of this historical chart we can see after the fact that was all the risk we needed. In real time the story is somewhat different. Whether we entered at the 38/50 or 62% level, a stop based on our methodology would need to be a minimum of 2 ticks above the swing high or 1439.75.
The difference between 1439.75 and 1431.75 is 8 points. In a live market our initial target would be the original swing low that got us into the trade - 1427.75. If you entered at the 38% level your anticipated profit on 1 contract would be 4.5 points. An entry at the 50% level presents a potential profit of 6 points. If you were extremely patient and waited for the 62% level to enter, your potential profit was 7.25 points. Because we teach, train and trade an aggressive risk management methodology, the risk/reward ratio would not have met our criteria. Interestingly enough, price sailed right through 1427.25 all the way down to 1416.50. Were we shocked, stunned, dismayed, discouraged? Did we wind up in a fetal position on the cold concrete floor of our War-Strategy-Break Room?
Not this time. We have a Business Plan and a Trading Plan which we do not deviate from. As a result, we will miss opportunities from time to time which in the rear view mirror look very handsome. The good news is, within short order an equally appealing trade that ticks every single box on our plan will come along and we will be prepared to act confidently and without hesitation.
Let's move on to a "not so perfect" textbook example:
 (ES) Fibs Hourly Downtrend 62% Retracement
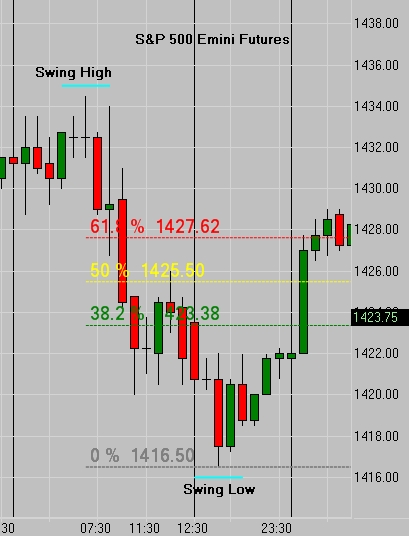
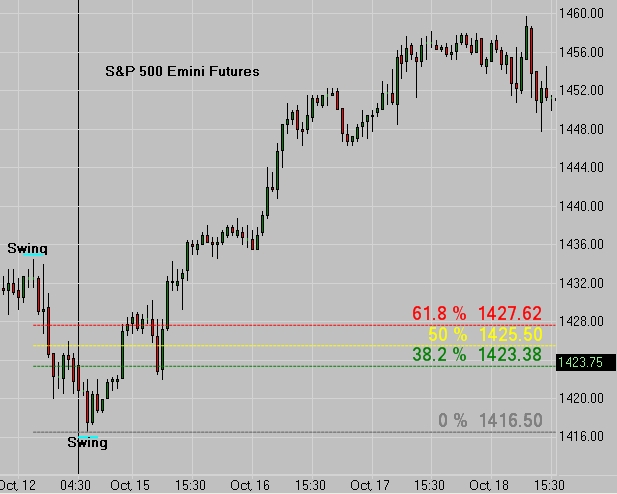
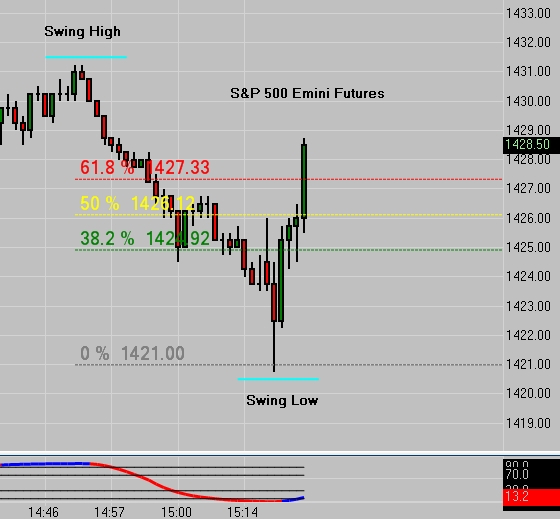
Our swing high is clearly established at 1434.50. Our swing low is equally as clear at 1416.50. This a significant move of 18 points and a great place to draw some Fibs. The 38% level at 1423.38 offers no resistance. The 50% retracement at 1425.50 also offers no resistance. In this example, one hourly candle moves all the way up to the 62% retracement at 1427.62 (round it down to 1427.50) before we run into any resistance whatsoever. Price not only meets resistance, it appears to be spell bound as it remains trapped in a 2 point range for the next 4 hours. If I were looking for a place to put "blind faith" to work, this would be the spot. Let's see what happens next -
 (ES) 62% Retracement Fails To Hold
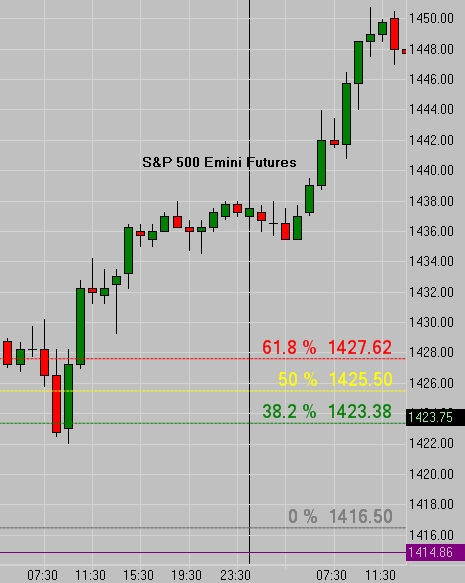
Clearly without a hard stop in place it would take very few trades such as this one to take you out of the ball game for good. Your business plan and your trading plan must both clearly address the use of a hard stop to prevent just this type of catastrophe. A few ticks above the swing high would have put your stop at 1435. We can clearly see that this was no simple pullback in a down trend, this was a stone cold reversal that rocketed all the way up to 1450 and beyond. That would be a 15 point draw down or $750 on just 1 contract. You may be thinking, "Surely it can't go any higher, it'll come back".
Those are some famous oft' spoken "last words".
 (ES) Pull Back Becomes A Reversal
Other than simply using a hard stop, was there any other way to address this setup? Of course, there always will be. However, no matter how many back up plans or clever ideas you have, nothing can offer the sense of safety and security that comes with having a hard stop in place on every single trade. It is the cheapest disaster insurance you will ever purchase. Don't leave home without it.
In this lesson we have learned how to draw Fibs in the context of a down trend and how to execute while maintaining a proper stop loss. We have also evaluated how to determine if a specific setup that the market is offering meets our risk profile criteria, or whether we should be content to wait for the next opportunity to come along. We also know exactly what it looks like when a pull back is no longer a pull back, but instead has become a reversal.
In the 3rd and final installment of this series we will address Fibonacci Extensions and how they can assist us in projecting price targets in our Emini Futures Trading.
---------------------------------------------------------------------
Sunday Night "Real-Time" Globex Update 10/21/12
We have used historical examples to teach you the principles of using Fibonacci Retracements in your Emini Trading business. Tonight we have the opportunity to show you a real time chart. We will update it through the night to give you a better idea of what it means to "think on your seat".
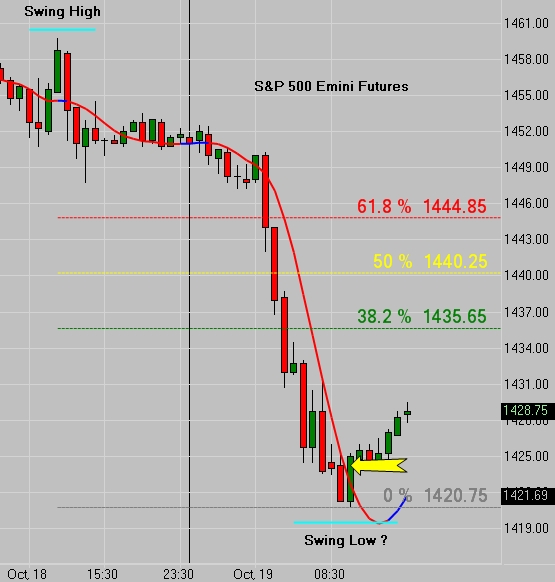
 (ES) Real Time Fibbing
At this point 4:39PM PDT, we do not know for certain if 1421.00 will indeed be the swing low. Our job now is to be patient and wait to see if price pulls back to one of the fib levels highlighted on the chart. If price trades lower before giving us a minimum 38% retracement, then we will know that we have not yet established the swing low. Before we can take any action we must be certain that we have a clearly defined swing high and swing low.
Stay tuned... we will post additional charts as the session progresses.
8:30PM PDT Update
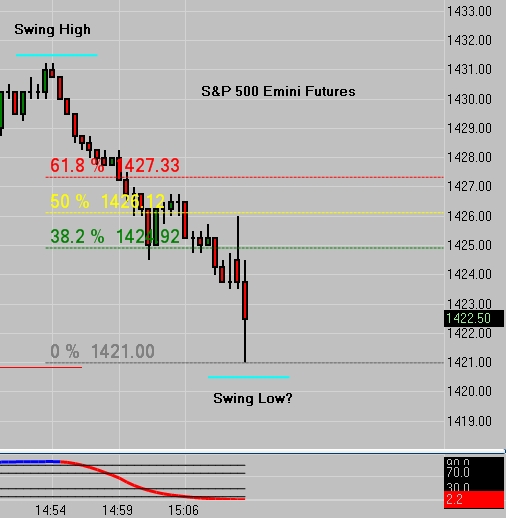
 (ES) 50% Retracement In Real-Time
As of 8:30PM PDT we not only have a clearly defined swing low, we also have a pull-back in a down trend to the 50% Fib Retracement Level. Do you sell here? If so, where should your stop be? Where should your target be? We will continue to update this chart as the session progresses and we will discuss the trade and field your questions tomorrow morning in the Live Trading Room and on the Daily Radio Broadcast.
10:06PM PDT Update
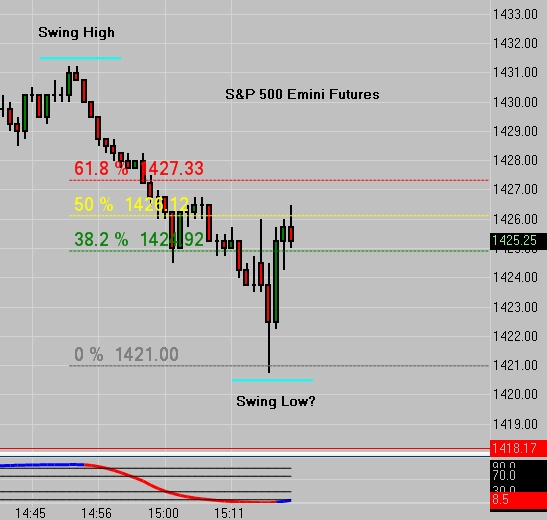
 (ES) 62% Fib Retracement Level Challenged
Price appears to have "blown through" the 62% retracement level and has now reached 1428.75. If you sold the market on "blind faith" at the the 38% level or 1424.75 (you have to round down to the nearest 1/4 point tick) you would currently be in a draw down of 4 points. Had you entered at the 50% Fib level you would be in a 2.75 point draw down. If you waited for the 62% Fib level at 1427.25 your draw down is 1.5 points.
No matter where you entered, where is your hard stop? Your target? We will be back with another update as the session progresses.
11:23PM PDT Update
 (ES) Late Night Fib Check - Hourly Chart
Throughout the Live Blogging Event we have used a volume chart. Price seems to have now taken a breather for the past 90 minutes at the 1428.75 area. To gain some clarity let's increase our altitude. Using an hourly chart we are able to clearly define Thursday's high of 1459.75 as our swing high. We have pulled fibs down across Friday's price action and into tonight's Globex activity.
As you can see from this vantage point we do not yet have a clearly defined swing low on an hourly chart. To reach the 38% Fib Retracement Level, price will need to continue climbing to 1435.65 (1435.50 as we round down to the nearest tick). Go back to the previous chart and look for 1435.50. It's "off the chart" as they say.
We have spent the bulk of this exercise tonight in real time, seeking a spot to potentially sell the market. Correct? There is another term for that - "Tunnel Vision". The only way to make you truly see it, was to blind side you with it. On the hourly chart where I have placed the yellow arrow, this represents the first hourly close above our primary indicator as discussed in our first lesson on Fibonacci. On every chart after a substantial move, I anticipate at least a 38% retracement.
Define Substantial Move: The current Daily ATR for this market is 15.4. From Thursday's high to tonight's low the market has dropped 39 points or roughly 2.5 times the daily ATR. However we are talking about 2 days, Thursday and Friday, along with the 8 hours the market has been open tonight. The math gets a bit tricky but spread out over 2 1/3 days and we are very close to that ATR figure of 15.4. Keep in mind, Average True Range has no directional bias. It is simply a measuring stick that reaches from the high of the day to the low of the day. The default "look back" window for the "average" part of the ATR formula on most platforms is 14 days.
If 1420.75 really is our swing low, by entering long at 1424.75 our initial target is 1435.50 which represents a potential 10.75 point rally. Our stop loss would need to be at leas 2 ticks below the current swing low. The risk then is 4.5 points. Am I comfortable risking 4.5 points for a shot at 10.75? Yes. In this example we would have utilized aggressive risk management so our stop loss would now be 1 tick above our entry or we could have exited with a 4.75 point profit. This means if we chose to remain in the trade we would now have zero risk and have also insured that the cost of the transaction was covered with the 1 tick of profit.
If we pursued that strategy, the worst thing that could happen is we break even or if the London open rallies we wake up smiling as our bracket order will have taken us out at our target. There is also the possibility that we could wake up and still be in the trade. Either way, with a hard stop in place and a live target in play, there's no need to toss and turn.
While we are increasing altitude let's also check on the daily chart. We have been building an ascending price channel since May 16th. Tonight we are bouncing off the bottom of that channel which is one more thing to consider when deciding which side of the market you want to be on. Because this is a large chart I will need to create a thumbnail. Simply click the small image below to enlarge it to full size.
;) (ES) Daily Price Channel
(ES) Daily Price Channel
This will be our last update for tonight. Join us at the opening bell and we will discuss this trade in full detail both in our Live Emini Trading Room as well as on our Daily Live Radio Broadcast.
-------------------------------------------------------------------
As opportunities unfold we will keep you posted.
Questions?
Call us toll free @ 866-928-3310 during normal business hours.
After Dark - email support@cfrn.net or call 415-857-5654
Connect with us: ![]()
![]()
![]()
![]()
![]()
![]()
Please leave a review on iTunes
5 DAY FREE TRIAL
 Editor
Reader Comments