


Emini FuturesCast / The Daily Pod 06/13/11
(QQQQ)(DIA)(SPY)(SLV)(GLD)

Da' Bears Back to Back
We talk about the Sentiment Indicator quite a bit. The reason? It works!
Have a look at Friday's action. The market rallied right up to our "line in the sand" at 1271 and then tanked 8 points to 1263.
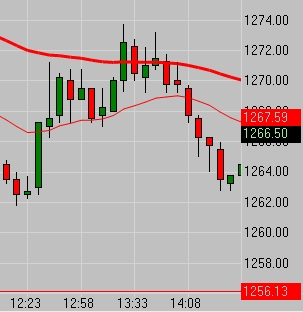
Today the market gapped up at the open and ran right into the "line in the sand" at 1270 and dropped 10 points to 1260.
If you owned this indicator and understood how to use it, could you have made a small profit over the past 2 days? If you had taken just 2 points a day out the 18 available, what would that look like?
-
1 Contract X 2 points X 2 days = $200.00
-
5 Contracts X 2 points X 2 days = $1,000.00
-
9 Contracts X 2 points X 2 days = $1,800.00
Of course trading is risky and you can lose all your money. I will never say it's easy, only simple. Often we forget that simplicity. We chase so many opportunities and layer so many things on top of each other that we lose sight of the simple and beautiful elegance that attracted us to trading in the beginning.
1 chart / 1 indicator / simply elegant...
E-Mini S&P 500: Turn around Tuesday?
The E-Mini S&P 500 seemed to focus on the energy sector and the semiconductor shares today! The semiconductor shares were down 1 , while Exxon Mobile declined 0.6 and Chevron was down 0.8 . The energies move down as demand becomes a concern and in this case a lot was built into today’s trading. The Euro Zone is still struggling with Greece's potential default and globally the forecast is glum. There are those looking for opportunity and the mergers and acquisitions are active! Allied World Assurance Co. Holdings Ltd., has agreed to buy Transatlantic Holdings Inc. for $3.2 billion in stock. VF Corp. tendered $2 billion for Timberland Co. for. Chinese Internet stocks succumbed to selling pressure as E-Commerce China Dangdang Inc. dropped 19.3 and Youku.com Inc. dropped 14.5 %.
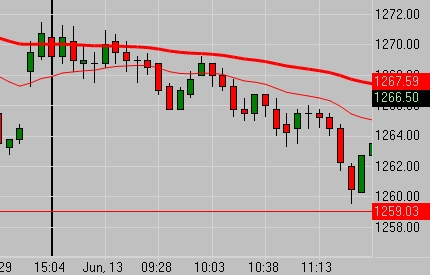
Tomorrow, we do not expect any incredible numbers on the US economic reports, but since so many analysts are looking for discouraging reports, it is likely that we may see a bounce. Today’s trading took us down to $1259.50. Support somehow held the number and tomorrow, we may see the same type of support. GDP is made up of retail sales, it is likely that we may have more of a bottoming effect through this. Japan’s earthquake had impeded the usual flow of auto parts to the US. The lack of parts may have slowed production here. Stocks may have been tightened, hence; leading to higher prices and lesssales. The energies may also hinder auto sales as families look to cut back on their daily errands or in fact rely on public transportation somewhat.
Tuesday, we have US Business Inventories, PPI and Retail Sales at 7:30 AM CST.
Tuesday, what to expect! We are technically in sell mode on the Daily Chart, but we are looking for a potential reversal as the E-Mini S&P 500 seems oversold! Tuesday, we look for an inside to higher day! Today’s range was $1271.75 - $1259.50. The market settled at $1266.25. Our comfort zone or point of control for this market appears to be $1265.75. Our anticipated potential range for Tuesday’s trading could be $1386.50 - $1259.50. The market stays bearish below $1302.75. While we are bearish overall, we look to buy the dips.
Connect with us: ![]()
![]()
![]()
![]()
![]()
![]()
 Editor
Reader Comments